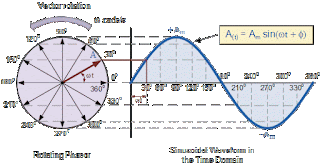
Explanation Of Phasor Diagrams - Sinusoidal waves have the same frequency can have a phase difference which states the angular difference between the two. The
term "precedes", "lagging behind", "a phase" and "different phase" is
used to indicate the relationship between one wave to wave the others
based on the general equation of wave: A = Am sin (ωt ± Φ) states wave
of a sine in units of time. However, the statement of a wave in the form of mathematics that
sometimes it is difficult to visualize, so as to express the difference
or phase angle of the wave can be presented graphically using the domain
space or phasor formed by phasor diagrams obtained from the vector
rotation method.
Basically
the method of rotation or rotation vector called a phasor, this method
is a measure line that states the value of the alternating current that
has a maximum value and direction (phase) at a particular point in time.
Phasor measurement method is vector which has a pointed tip at one
arrow that indicates the maximum value of a vector (V or I) and the body
as a marker of the end of the round arrow of a vector.
In
general, the direction of the arrow phasor diagrams vectors are assumed
to refer to a zero point called the reference point, while the declared
value of the size of the tip of the arrow that rotates through the
opposite direction to clockwise which has an angular velocity (ω). Vector rotates counter-clockwise rotation is regarded as a positive value. Conversely, rotation clockwise rotation is negative.
Although
the term vector and phasor is used to describe a line that rotates that
has magnitude and direction, the main difference between the two is
that the amount used for the vector is the "maximum value" sinusoidal
wave, while the magnitude of the phasor is the "effective value" wave. But the phase angle and direction on both is the same.
Phase
alternating electric system at a certain time point can be illustrated
by the phasor diagrams, phasor diagrams can be said to be a "formula
function of time". A
full sine wave can be created with a vector that rotates at the angular
velocity ω = 2πƒ, with f as the frequency of the wave. Then Phasor is a measure that has a value of "direction" and "magnitude". Generally when drawing phasor diagram, the angular velocity is always assumed as a sine wave ω in units of rad / s. We take phasor diagram below as an example.

0 Response to "EXPLANATION OF PHASOR DIAGRAMS"
Post a Comment